Facebook Ad Agency Metrics Every Brand Should Track
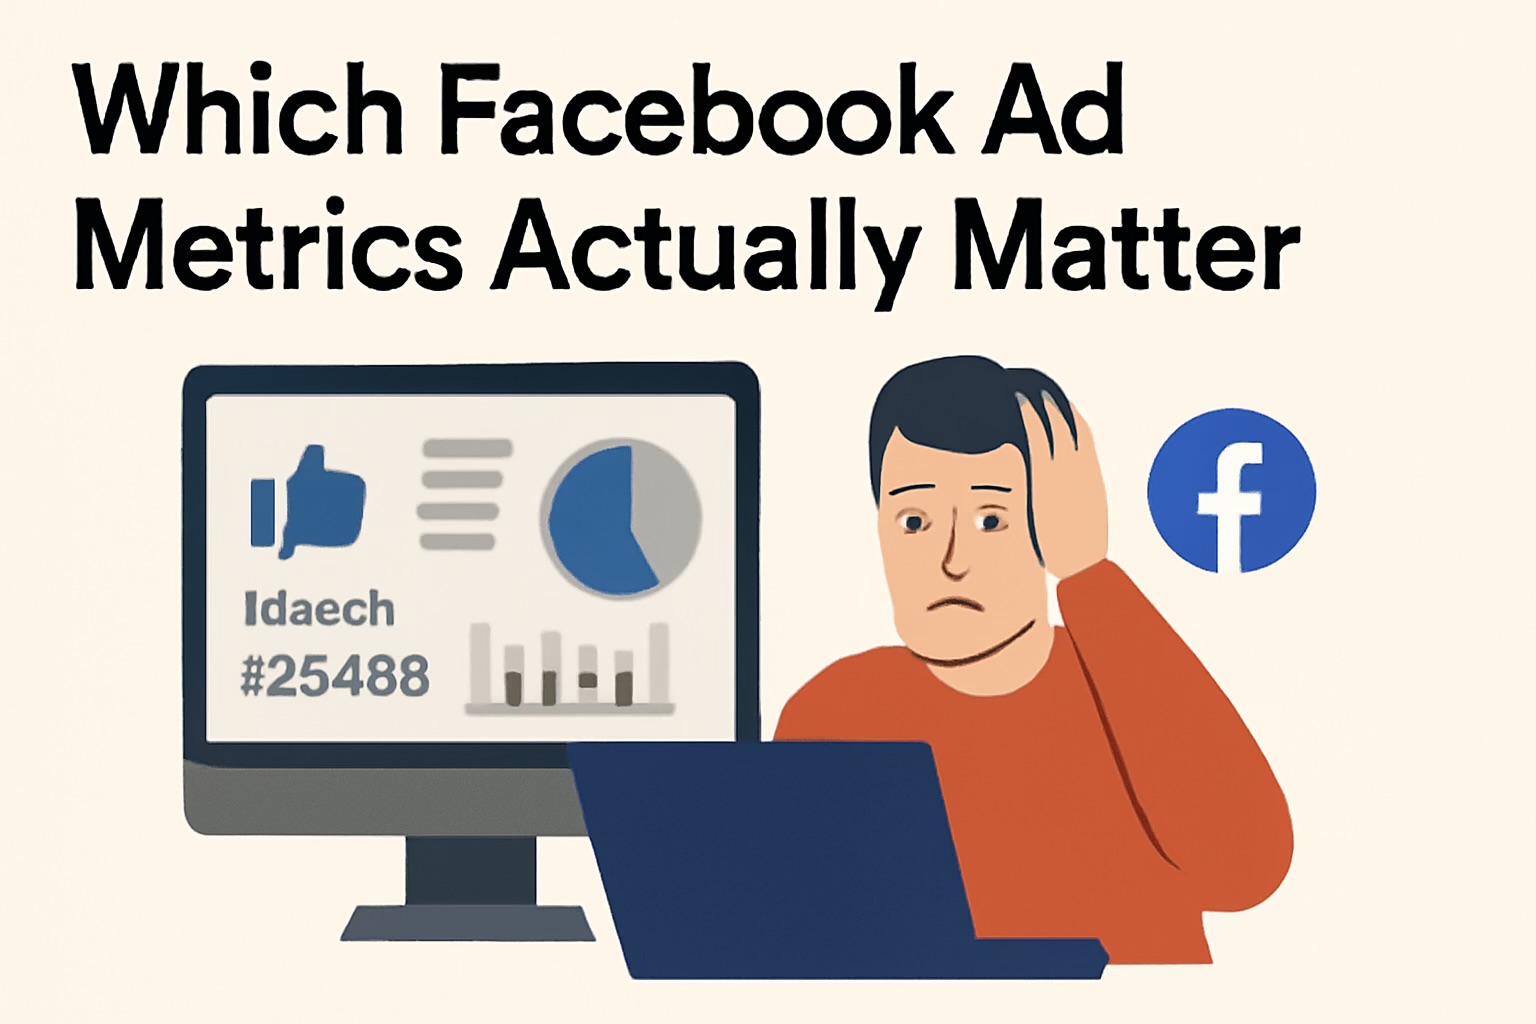
Your Facebook Ads Manager from the agency you hired gives you so many metrics, it can feel like you’re staring into the abyss. But here’s the deal—tracking everything is like trying to boil the ocean. The best Facebook ad agencies in the U.S. know what matters, and more importantly, why it matters.
You don’t just need data. You need direction. This blog breaks down the good, the vanity, and the confusing. We’ll talk signs that seem bad but aren’t, and ones that look fine but scream trouble. Plus, we’ll reference benchmarks and real facebook ad agency practices from across cities like Austin, Miami, and New York.
Vanity Metrics: The Numbers That Look Good But Fool You
- Page Likes: Unless you’re running a brand awareness campaign, likes alone don’t move the needle.
- Reach Without Context: High reach sounds impressive—until you realize most viewers didn’t engage or convert.
- Post Engagement: A viral video with no link clicks or conversions is still a failed campaign if your goal was lead gen.
“Including vanity metrics, such as likes or reach, will only detract from the important metrics that actually help you monitor the success of your advertising campaigns.”
— Akvile DeFazio, President, AKvertise
Metrics That Actually Matter (And What Good Looks Like)
Here’s what the best Facebook ads agencies track:
a. Performance Metrics
- ROAS (Return on Ad Spend): The north star. A 4:1 ROAS is good for eCommerce, but SaaS or services might be happy with 2:1.
- CPA (Cost Per Action): Good if under industry benchmark (e.g., $15-$50 for leads, depending on vertical).
- Conversion Rate: Under 1% = trouble. 2-4% is typical. 5%+ means you nailed the offer or audience.
b. Efficiency Metrics
- CPC (Cost Per Click): National average = $0.50. Higher isn’t always worse if ROAS is strong.
- CTR (Click-Through Rate): 1.5%-2% is standard. Above 3%? You’re doing something right.
- Add-to-Cart Rate: For eCommerce brands in cities like Los Angeles or Atlanta, a 7-10% ATC rate is a solid benchmark.
c. Delivery Metrics
- Frequency: If you’re above 3 and ROAS is dropping, it’s time to refresh creatives.
- Impressions vs. Reach: Helps assess saturation. If reach is flatlining and frequency’s up, you’re hitting the same people too often.
d. Custom Events
- Track what matters to you—downloads, signups, in-app actions. Agencies in tech hubs like San Francisco often build custom metrics into every campaign.
Match Metrics to Funnel Stage
Not all metrics matter equally at every stage:
- Top of Funnel: CTR, CPM, video views, reach
- Middle: CTR + conversion rate, landing page views
- Bottom: ROAS, CPA, conversion value, cart abandonment rate
A New York fashion brand got 500,000 views on a TOFU video ad, but no bump in ROAS. The Facebook ad management agency shifted to a carousel retargeting ad that doubled their conversion rate.
Metric Anomalies: When Good Looks Bad (Or Vice Versa)
- High Frequency, Good ROAS? Don’t panic. Maybe you’ve got a loyal audience (common in small markets like Boise or Charleston).
- Low CTR, High Conversion? It might be ultra-qualified traffic. No need to fix what isn’t broken.
- High CTR, Low ROAS? Your ad is clickbait. Align your messaging and landing page.
Watch for platform shifts, too. iOS updates, CPM spikes in Q4, or sudden inventory competition (like during Miami Art Week or Black Friday) can skew data.
5. Reporting Practices from Top U.S. Agencies
- Dashboards over PDFs: Agencies in cities like Chicago and Seattle prefer real-time dashboards (e.g. via Looker Studio or AgencyAnalytics).
- Custom Reports by Objective: Lead gen gets a different report than eCom.
- Contextual Notes: The Facebook ad agency doesn’t just send numbers. They interpret them.
“Success in Facebook Ads now goes beyond reach or creative ideas. It’s about understanding which numbers count and in what order.”
6. Red Flags in Agency Reporting
- Too much focus on reach, not results: Reach tells you how many people saw your ad, but not what they did with it. For instance, a campaign in Miami may reach 100,000 people, but if no one clicks or converts, that data is just noise. A better metric? Cost per lead or ROAS.
- No breakdown by funnel stage or creative type: Without separating TOFU (top of funnel) from BOFU (bottom of funnel), or video ads from carousel ads, it’s impossible to know what’s working where. A Chicago-based ecommerce Facebook ad agency that split reports by funnel stage found their middle-funnel product demo videos outperformed their generic awareness ads by 3x.
- No mention of benchmarks or context: Telling a client their CTR is 1.8% is meaningless without knowing the industry average. A restaurant chain in Austin might think 1.8% is low, until they learn that the industry benchmark is 1.2%.
- Weekly wins with no trend analysis: Reporting that “this week ROAS is 3.5” sounds great. But is that up or down from the past 4 weeks? Agencies that use rolling trend analysis in places like San Francisco offer more strategic advice because they can predict what’s next, not just what happened.
What You Should Track Weekly, Monthly, Quarterly (With Examples & Context)
Weekly Metrics
These metrics help you catch early signs of trouble or opportunity.
- ROAS (Return on Ad Spend): If ROAS drops from 3.5 to 2.1 week-over-week, it could signal creative fatigue or targeting issues. Ex: A Miami-based beauty brand sees their ROAS drop after an influencer campaign ends.
- CTR (Click-Through Rate): A spike in CTR might mean your new hook is working. Ex: An Austin brand testing humorous ad copy sees CTR jump from 1.2% to 2.5% in a week.
- Spend: Track budget allocation across campaigns. Ex: A New York facebook ad agency discovers $800 extra was accidentally spent on a retargeting ad.
- CPA (Cost Per Action): If CPA is rising, reassess ad relevance or landing page performance. Ex: A Chicago B2B SaaS firm sees CPA go from $45 to $72—turns out, a form field was broken.
- Frequency: Above 3? Time to refresh creatives. Ex: An Atlanta eCom store runs the same static ad for 4 weeks and sees frequency hit 5, along with ROAS decline.
What to Add Weekly
- Source Data Access: Ask for read-only access to Meta Ads Manager to verify reported metrics.
- Ad Verification Metrics: Look at invalid traffic or bot clicks (tools like DoubleVerify can help).
- Anomaly Detection: Ex: CTR spikes 300%—is it a new ad or a reporting bug?
- Segmentation: Ensure metrics are broken down by age, device, or creative. Ex: 18-24 users on Instagram Stories are converting at 3x the rate of 45+ on Facebook Feed.
- Consistency Checks: Compare weekly ROAS to 3-week average. Ex: This week’s drop is an outlier or a trend?
Monthly Metrics
This view helps identify patterns and validate the effectiveness of your funnel.
- Conversion Rate: See how well clicks turn into actions. Ex: An LA lifestyle brand converts at 1.9%, just under their 2.5% target.
- AOV (Average Order Value): Track purchase value growth. Ex: A Brooklyn boutique raises AOV from $42 to $60 by bundling products.
- Add-to-Cart Rate: Monitor user intent. Ex: Add-to-cart drops from 9% to 6% after changing product images.
- New vs Returning Users: Indicates loyalty or prospecting balance. Ex: A San Diego skincare brand sees 70% returning users after a retargeting push.
What to Add Monthly
- Attribution Transparency: Know whether results are last-click or data-driven. Ex: A campaign appears underperforming—until switching from last-click to 7-day view.
- Pixel Audits: Check if all conversions are tracked. Ex: An Omaha DTC brand finds pixel wasn’t firing on mobile Safari.
- Channel Reporting: Compare Facebook vs Instagram vs Google. Ex: Instagram Reels drives 3x the AOV of Facebook Feed.
- Cohort Analysis: Are first-time buyers from March converting again in May?
- Benchmarking: Use Meta’s benchmarks or your 6-month average to add meaning.
Quarterly Metrics This long-view lens supports strategic decisions.
- Creative Fatigue: Check if performance drops after repeated exposure. Ex: A Denver gym ad starts strong, then CTR halves after 6 weeks.
- LTV/CAC (Lifetime Value vs Cost to Acquire): Ensure you’re not overspending to acquire short-term customers. Ex: A Seattle meal-kit company finds CAC is $80, but LTV is just $90—not scalable.
- Attribution Shifts: Track changes over time. Ex: After iOS 17 update, attributed conversions dip 20% in Meta.
What to Add Quarterly
- Raw Data Review: Ask for calculation sheets behind CAC and LTV.
- Creative Logs: Track launch dates and pauses to prove fatigue wasn’t ignored.
- Attribution Change Logs: If an agency changes from 7-day to 1-day click, demand a before/after report.
- Churn & Retention: Are customers staying or bouncing after one order?
- Third-Party Audit: Bring in outside analysts or tools like Triple Whale to validate numbers.
Bottomline
At the end of the day, tracking fewer but smarter metrics is what separates a generic facebook ad agency from the best facebook ads agency you can hire. Focus on metrics that tell a story—not just fill a spreadsheet.
Remember: one number rarely tells the full truth. But the right mix of ROAS, CTR, CPA, and conversion signals? That’s your cheat code to profitable scaling.
Looking for a facebook ad management agency that knows how to read the numbers and act on them? Choose facebook ads agency that treats your metrics like a roadmap—not a report card.